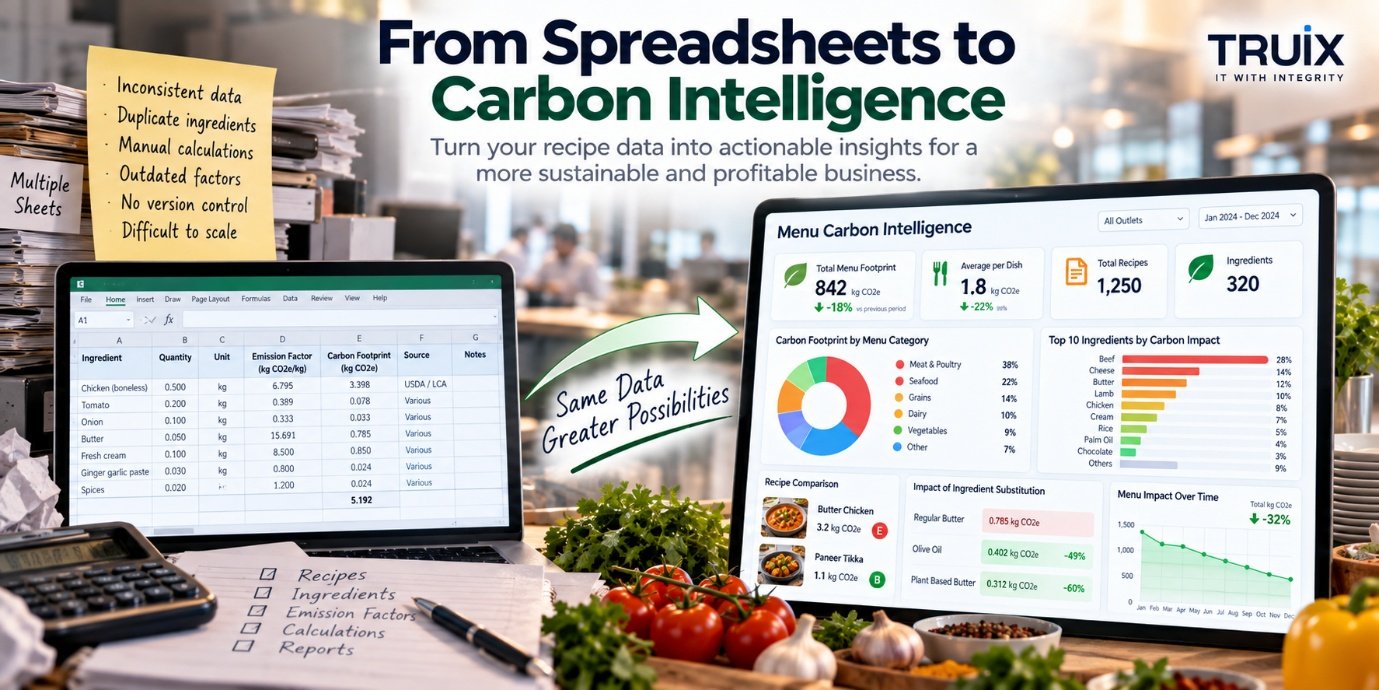
For many businesses, the sustainability journey begins with a spreadsheet.
One sheet contains ingredients. Another contains emissions factors. Another contains recipes. Someone manually calculates carbon emissions. Another person prepares a report. Someone else turns the numbers into a presentation.
It works. At least for a while.
But as the amount of data grows, spreadsheets can become difficult to maintain, difficult to audit and increasingly disconnected from the business processes they are supposed to support.
The bigger opportunity is not simply to replace the spreadsheet. It is to move from carbon calculation to carbon intelligence.
The Spreadsheet Is Often Where Carbon Data Begins
Spreadsheets are useful because they are flexible. A sustainability team can quickly create columns for:
A formula can then calculate the estimated emissions. For a small number of recipes, this may be perfectly practical. The problem begins when the spreadsheet becomes the central system for managing an entire carbon dataset — the same tipping point we describe in When Your Business Has Outgrown Excel.
Suddenly, the business may have thousands of ingredients, hundreds or thousands of recipes, multiple outlets, different suppliers, changing emissions factors and multiple people working with the information. The spreadsheet is no longer just an analysis tool. It has become a business system. And that is where problems can start.
Carbon Data Is More Than a Number
A carbon footprint number can look deceptively simple. For example:
2.4 kg CO₂e per dish
But where did that number come from? A meaningful carbon result may depend on — the same variables we unpack in Understanding the Carbon Footprint of a Recipe:
Two calculations can produce different results because they use different assumptions. That does not automatically mean one calculation is wrong. It means the underlying methodology matters. This is why carbon data should not simply be stored as a number.
It should be stored with its context and provenance.
The Problem With a Growing Carbon Spreadsheet
Imagine a hotel group with:
The spreadsheet that originally seemed convenient can become increasingly difficult to manage — the same environmental-reporting strain we cover in How Hotels Can Use Menu Data to Understand Environmental Impact. You may encounter:
And there is another problem:
The carbon data is often disconnected from the recipes themselves.
The recipe exists in one system. The carbon calculation exists in another. The menu exists somewhere else. Procurement data may exist somewhere else again. This creates an information gap.
From Ingredient Data to Carbon Data
A better approach starts with the ingredient — treated as a strategic asset in its own right, as we explore in Why Ingredient Data Is a Strategic Business Asset. Consider:
That ingredient can then become part of a recipe. For example:
The calculation becomes part of the recipe's underlying data rather than a separate spreadsheet exercise. This is a fundamental shift.
Recipe Data Creates the Connection
Once recipes are structured — the same transformation we describe in What Happens When Recipes Become Data? — carbon information can become part of a much larger data model. Consider a single recipe. It can contain:
The same underlying recipe can therefore support several business functions:
- What should be prepared?Kitchen
- What does it cost?Finance
- What nutrients does it contain?Nutrition
- What allergens must be communicated?Compliance
- What is its estimated environmental impact?Sustainability
- Which ingredients are being purchased?Procurement
- Which menu items are performing well?Management
This is where structured recipe data becomes more valuable than a carbon spreadsheet.
What Is Carbon Intelligence?
- "What is the estimated carbon footprint?"Carbon Calculation
- "What is driving it, what changed, why, and what can we do?"Carbon Intelligence
That distinction is important. A dashboard showing that a dish has a carbon footprint of 3.2 kg CO₂e is useful. But a system that can also show:
is considerably more useful for decision-making.
The number becomes information. The information becomes insight. The insight can support action.
Carbon Hotspots Become Visible
One of the most useful capabilities of structured carbon data is identifying hotspots. Imagine a menu containing 500 dishes. Instead of reviewing every recipe manually, the system can help identify:
This changes the sustainability conversation. Instead of asking:
"What is our total carbon footprint?"
the business can start asking, "Where should we focus our attention?"
What Happens When a Recipe Changes?
This is one of the strongest arguments for moving beyond spreadsheets. Imagine a recipe originally contains 100 g of ingredient A, and the chef changes it to 70 g ingredient A + 30 g ingredient B.
In a disconnected spreadsheet, someone may need to remember to update the carbon calculation. In a structured system, the recipe change can trigger a recalculation. The same change could potentially affect:
One recipe change becomes a data event. This is much closer to carbon intelligence than simply maintaining a static carbon report.
Supplier Data Can Add Another Layer
Ingredient-level carbon data can begin with generic emissions factors. But businesses may eventually have access to more specific information — the same progression we describe in Better Carbon Data Starts With Better Emissions Factors. For example:
As data quality improves, the system can potentially become more representative of the actual supply chain. However, more detailed data does not automatically mean better data. Supplier information still needs to be evaluated for:
Carbon intelligence requires not just more data, but better governed data.
Geography Matters
An emissions factor should not be treated as a universal property of an ingredient. Production methods, energy systems, agricultural practices, processing and supply chains can vary by geography. This means an emissions factor selected for one region may not perfectly represent another.
In real-world carbon modelling, local or regional data may not always be available. That is where proxy values can become useful. But the proxy should be documented. A good carbon data model should be able to answer:
- What value was used?
- Where did it come from?
- What geography does it represent?
- What year is the data from?
- Why was it selected?
- Was a proxy used?
- What assumptions were made?
That information is just as important as the final number.
Version Control Matters
Carbon datasets change. Recipes change. Suppliers change. Ingredients change. Methodologies change. This means carbon information should ideally have version control.
Consider a recipe that was analysed in January. Six months later, the emissions factor for one of its ingredients is updated. If the system simply overwrites the old value, it may become difficult to understand why historical results changed. A more controlled approach could maintain:
Each version can have its own source, date, geography, methodology and assumptions. This improves traceability and reproducibility.
From Carbon Reports to Carbon Monitoring
A spreadsheet often creates a snapshot. A connected system can create an ongoing view. Instead of producing a carbon report once a year, businesses can potentially monitor:
This creates a much more dynamic sustainability process. The question changes from:
"What was our carbon footprint?"
to "What is changing, and what is driving that change?"
Carbon Intelligence Can Connect With Menu Engineering
Restaurants and hotels already make menu decisions using several variables — the same multi-layered approach we describe in Building More Sustainable Menus With Better Data: popularity, food cost, selling price, profitability, preparation time, nutrition and customer preferences. Environmental impact can become another information layer. Imagine a menu analysis that shows:
- High Popularity, Low Cost, Low CarbonDish A
- High Popularity, Medium Cost, High CarbonDish B
- Low Popularity, High Cost, Medium CarbonDish C
The purpose is not to automatically declare one dish "good" or another "bad." Instead, the business has more information with which to evaluate its menu. Carbon becomes part of menu intelligence.
Carbon Data Can Connect to Procurement
The connection does not stop at the menu. Recipe data can connect to purchasing information. For example:
This creates the possibility of analysing carbon information alongside procurement decisions. A supplier change may affect:
A connected system can help businesses understand these relationships.
Waste Is Another Important Layer
Recipe carbon analysis can also become more useful when connected with food waste information. Consider:
The carbon footprint associated with food that is ultimately discarded represents a different business question from the footprint of food that is consumed. Connecting recipe, production and waste data can therefore provide a more complete picture of where environmental impact occurs. The challenge is that this requires more than a recipe spreadsheet. It requires connected operational data.
AI Can Add Another Layer of Intelligence
Once carbon information is structured, AI can potentially help identify patterns that would otherwise require manual analysis — the same kind of judgement call we cover in The AI Journey: What Businesses Should Automate First. For example, AI could assist with:
But AI should not be expected to fix poor underlying data. If ingredient mapping is incorrect, an AI system can still produce an impressive-looking answer based on incorrect information.
No amount of analytics or AI can compensate for duplicated ingredients, inconsistent units or undocumented assumptions sitting underneath the numbers.
The Technology Stack Behind Carbon Intelligence
A mature carbon intelligence system does not need to be a single application. It can be built as a connected technology environment:
Each layer has a different role. The database stores information. The calculation engine performs the mathematics. APIs connect systems. Analytics presents patterns. AI can help interpret information. People make decisions.
What Should Happen to the Spreadsheet?
The answer isn't necessarily "delete all spreadsheets." Spreadsheets remain useful for analysis, modelling, exploration and ad-hoc work. The problem occurs when a spreadsheet becomes the only system holding critical operational information. A better approach can be:
- Analysis ToolSpreadsheet
- Source of Structured InformationDatabase
- Business WorkflowApplication
- System IntegrationAPI
- Repetitive ProcessesAutomation
- Interpretation and IntelligenceAI
This creates a more sustainable technology architecture.
A Practical Roadmap
Businesses don't have to build a complete carbon intelligence platform overnight. A practical progression might be:
Standardise ingredient names, units, recipes and emissions factors.
Create a structured ingredient and emissions-factor database.
Link ingredients, quantities, yields and portions to recipes.
Calculate carbon footprints consistently using defined methodology.
Record sources, dates, geography, assumptions and versions.
Identify hotspots, trends and changes.
Integrate procurement, menu, costing and operational data.
Use analytics and AI to identify patterns and support decision-making.
This approach allows businesses to mature their carbon capability gradually.
The Real Value Is Not the Dashboard
A beautiful sustainability dashboard can be useful. But a dashboard alone does not create carbon intelligence. The real value comes from what sits underneath it:
The dashboard is simply the window into that system.
The TRUIX Perspective
At TRUIX, we see carbon footprint analysis as more than a calculation exercise. The real opportunity is to turn carbon information into part of the business's broader data infrastructure.
A recipe should not exist in isolation. Its ingredients can connect to nutrition, allergens, cost, procurement and environmental information. That information can then connect to menus, outlets, suppliers, reporting and analytics. The journey is therefore:
The goal is not to eliminate spreadsheets. The goal is to make sure the business is no longer dependent on them to understand its environmental data.
Because the future of carbon management is not simply knowing how much. It is understanding why, where, what changed, and what could happen next.
and carbon intelligence.
Related Reading
- Why Good Sustainability Reporting Starts With Good Data
- How Technology Can Automate Carbon Accounting
- Why Ingredient Data Is a Strategic Business Asset
- How AI Can Change Recipe and Menu Management
- Understanding the Carbon Footprint of a Recipe
- Better Carbon Data Starts With Better Emissions Factors
- How Hotels Can Use Menu Data to Understand Environmental Impact
- Building More Sustainable Menus With Better Data
- Why Ingredient Data Is a Strategic Business Asset
- What Happens When Recipes Become Data?
- When Your Business Has Outgrown Excel
- The AI Journey: What Businesses Should Automate First
- Carbon Footprint Analysis