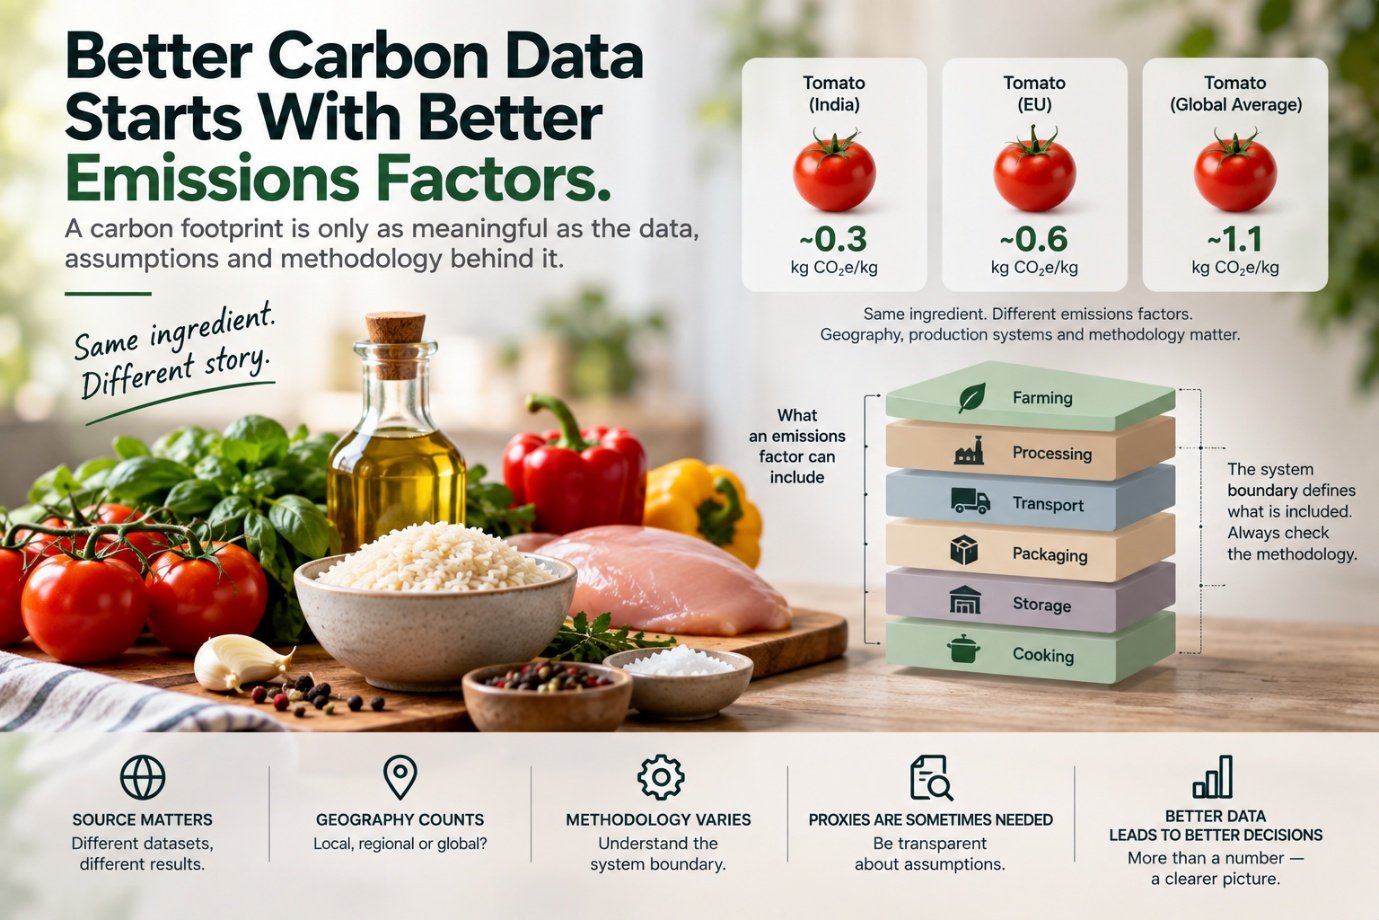
When a restaurant or hotel calculates the carbon footprint of a dish, the final result may look deceptively simple: 1.85 kg CO₂e per serving. It is a precise-looking number.
But where did it come from? What ingredients were included? Which emissions factors were used? What geography does the data represent? Does the factor include farming, processing and transport? Was cooking included? How was the recipe yield calculated? What happens when no directly matching emissions factor exists?
These questions matter because carbon analysis is not simply about producing a number. It is about producing a number that has context, traceability and a clearly defined methodology. And one of the most important components of that methodology is the emissions factor.
What Is an Emissions Factor?
An emissions factor represents the estimated greenhouse-gas emissions associated with a defined quantity of a material, activity or product. For food carbon analysis, it may be expressed in a form such as kg CO₂e per kg of ingredient. A simplified recipe calculation might look like:
The calculation itself is straightforward. The difficult question is: why is the emissions factor 3 kg CO₂e/kg? That is where carbon analysis becomes a data-quality problem.
There Is No Universal Carbon Number for Every Ingredient
One of the most important things to understand about food carbon data is that an ingredient doesn't necessarily have one universally applicable emissions factor. The environmental impact of a product can vary depending on factors such as:
Consider something as common as rice. Rice produced in one region may have a different emissions profile from rice produced elsewhere. Different cultivation practices can produce different results, and different datasets can use different methodologies. Therefore, simply searching for "carbon footprint of rice" and selecting the first number found isn't necessarily a robust approach. The question should instead be: "Which emissions factor is appropriate for the rice represented in this recipe and under our defined methodology?"
The Source Matters
Carbon data comes from many places. Depending on the ingredient and analysis methodology, sources may include:
These sources don't necessarily provide identical numbers. That doesn't automatically mean one is wrong — they may simply be answering slightly different questions, using different geographies, production systems, system boundaries, allocation methods, time periods, functional units or data-quality assumptions.
A good carbon methodology needs a defined framework for choosing sources — not simply a collection of numbers picked as they're found.
Data Quality Is More Important Than Decimal Places
Imagine two carbon databases provide 2.73 kg CO₂e/kg and 2.81 kg CO₂e/kg. It is tempting to assume that 2.73 is more accurate because it contains two decimal places. But precision and accuracy are not the same thing. If the underlying data has substantial uncertainty, reporting 2.7346 kg CO₂e/kg doesn't make the result more scientifically accurate. The quality of the source and its relevance to the ingredient matter far more than the number of decimal places.
This is an important principle in carbon analysis.
Don't confuse numerical precision with data quality.
Geography Can Change the Answer
Food is produced around the world. A tomato grown in one region may not have the same environmental profile as one grown in another. The same applies to:
Electricity mixes, agricultural practices, climate conditions, production systems and supply chains can all differ. Therefore, geography should be considered when selecting emissions data. For a business operating in India, for example, an India-specific source may be preferable where appropriate and available. If a suitable India-specific dataset isn't available, a regional proxy may be considered — and if that isn't available, a broader international source may be used. The important thing is not to pretend that a global average is an exact representation of a local ingredient. It is a proxy, and should be treated as such.
What Happens When No Exact Data Exists?
This is one of the most practical challenges in food carbon analysis. A recipe might contain hundreds of ingredients, and not every ingredient will have a perfectly matching emissions factor. You may encounter:
So what happens? The methodology needs a clear proxy approach:
This is much better than silently choosing a number without explaining why.
Proxy Data Is Not Automatically Bad Data
Using a proxy doesn't necessarily make a carbon calculation useless. In real-world environmental analysis, data gaps are common — the key is transparency. Suppose a recipe uses a specific processed ingredient for which no suitable emissions factor can be identified. A methodology might use a comparable product based on:
The resulting value should then be identified as an assumption or proxy rather than presented as supplier-specific measured data. This allows users to understand the limitations of the calculation.
Transparent uncertainty is better than false certainty.
System Boundary Changes the Number
Emissions factors cannot be evaluated properly without understanding what they include. Consider the journey of an ingredient:
Which parts are included? That depends on the defined system boundary. One analysis may focus on production. Another may include processing and transport. Another may extend through preparation and consumption. These results shouldn't automatically be compared as though they measure exactly the same thing. This is why carbon analysis needs a clearly stated boundary.
"Farm to Fork" Is Not a Single Universal Calculation
The phrase farm to fork sounds straightforward. But in practice, it can encompass different stages depending on the methodology.
- Narrower DefinitionProduction → Processing → Transport → Retail
- Broader DefinitionProduction → Processing → Transport → Storage → Cooking → Waste
The important thing isn't choosing a phrase that sounds comprehensive. It is clearly defining what is included, what is excluded, what assumptions apply, and which stages are covered by the emissions factors. This prevents misleading comparisons.
Recipe Data and Emissions Data Have to Meet
This is where our earlier discussion about recipes becoming data becomes important. An emissions factor on its own doesn't tell you the carbon footprint of a dish. A recipe on its own doesn't tell you the carbon footprint either. You need to connect them — as we explored in Understanding the Carbon Footprint of a Recipe. For example:
- Chicken1.5 kg
- Onion0.5 kg
- Tomato0.4 kg
- Oil0.1 kg
- Spices0.03 kg
Then the system maps each ingredient to the relevant emissions data, and the calculation can aggregate the estimated contribution of each ingredient:
This is why structured recipe data — the same foundation described in Why Food Carbon Accounting Starts With the Recipe — is so important.
Ingredient Mapping Is a Hidden Technical Challenge
One of the least visible parts of carbon analysis is ingredient mapping. A recipe might contain "cooking oil." But which oil?
The carbon footprint can vary significantly depending on the actual ingredient. Similarly, "milk" could represent:
The database needs to understand what the recipe actually represents. This is why a carbon platform needs more than a calculator — it needs a well-structured ingredient model.
Composite Ingredients Create Another Challenge
Consider a restaurant using a commercially produced sauce. The recipe may simply say "sauce — 200 g." But the sauce itself contains:
If the product has a reliable product-specific environmental footprint, that information may be usable depending on the methodology. Otherwise, the business may need to model the product using its component ingredients and appropriate assumptions. The same problem occurs with:
The deeper you go into a professional kitchen, the more important recipe hierarchy becomes — the same complexity described in The Hidden Nutritional Complexity of a 5-Star Hotel Menu.
Supplier Data Can Improve the Picture
Generic emissions factors are useful. But where reliable supplier-specific information exists, it may provide more relevant information for a particular product — for example, environmental data associated with a specific product or production system, which can potentially improve the representativeness of the calculation. However, supplier data should still be evaluated carefully. Businesses should understand:
- What methodology was used?
- What boundary was applied?
- What unit was used?
- What period does the data represent?
- Is the information independently verified?
- Is it comparable with other data being used?
A supplier-provided number shouldn't automatically be treated as superior simply because it came from the supplier. Traceability and methodological consistency still matter.
Data Needs Version Control Too
Carbon data isn't necessarily static. Datasets are updated, research evolves, methodologies improve, suppliers change and ingredient sourcing changes. A business may therefore need to know: which emissions factor was used when this calculation was performed? This is especially important when historical reports need to be reproduced — imagine a hotel calculated its menu footprint in 2026, and six months later an emissions dataset is updated. Should the historical result automatically change? Not necessarily; the answer depends on the reporting methodology and purpose. A robust system should be able to record:
This makes the result much easier to audit and explain.
The Calculation Should Be Reproducible
A good carbon result should not be a black box. If someone asks "how did you arrive at this number?" the system should ideally be able to trace the calculation:
This is particularly important for businesses that want to use carbon data for reporting, internal decision-making or customer-facing communication. The ability to reproduce a result creates confidence.
Carbon Scores Can Simplify Complex Information
Businesses often want a simple way to communicate carbon impact. For example, a menu might display a carbon category or score alongside the estimated footprint, making complex information easier to understand. But the underlying methodology still matters. A simple label should be backed by:
The simplicity should exist at the presentation layer. The underlying data should remain rigorous.
Carbon Data Should Support Decisions, Not Dictate Them
Suppose a restaurant discovers that one dish has a higher estimated carbon footprint than another. That doesn't automatically mean the higher-impact dish should be removed. There may be other considerations:
Carbon is one decision variable. Not the only one. The purpose of good carbon intelligence — much like the actionable nutrition intelligence described in Nutrition Analysis Is Only Valuable When It Becomes Actionable Data — is to give decision-makers better information. It is not to replace their judgement.
The Same Data Can Support Recipe Optimisation
Once emissions information is connected to the recipe, businesses can explore scenarios: what happens if we reduce the quantity of an ingredient, substitute an ingredient, change the portion, change the supplier, or ask which ingredients contribute most to the recipe footprint? This moves carbon analysis from:
That is where technology can create significantly more value.
Carbon Analysis Is Also a Data-Governance Problem
As organisations scale, carbon data needs governance. Someone needs to define:
Without governance, two teams may calculate the same ingredient differently — one using a local dataset, another a global average, a third a supplier value. All three could produce technically calculated results, but they may not be comparable. A methodology, much like the systems-first approach described in Why Businesses Should Stop Buying Software and Start Building Systems, creates consistency.
A Practical Source Hierarchy
There is no single hierarchy that is correct for every organisation, but a structured approach can be useful:
Where appropriate and available.
Particularly where the geography matches the ingredient.
Where applicable.
When suitable datasets aren't available.
For a comparable ingredient or production system.
When more relevant data isn't available.
The exact hierarchy should be documented by the organisation performing the analysis. The important principle is: don't select emissions factors randomly.
Better Data Doesn't Mean Perfect Data
There is no realistic scenario where every ingredient in every recipe will have perfect, supplier-specific, current environmental data. Food supply chains are complex, data availability varies, measurement methodologies differ, and research continues to evolve. The objective should therefore be relevant data, transparent methodology, documented assumptions and consistent application — rather than pretending to have perfect certainty.
A well-documented estimate can be much more useful than an unexplained number presented as fact.
What Businesses Should Ask Their Carbon-Analysis Provider
Before accepting carbon results, businesses should ask:
- Where do your emissions factors come from? The source should be identifiable.
- What geography do they represent — local, regional or global?
- What system boundary is being used — production only, supply chain, or preparation?
- How are missing ingredients handled? Are proxies used?
- How are ingredients mapped? Can the business verify the correct ingredient was selected?
- Are sub-recipes included? Sauces, stocks and marinades shouldn't disappear from the calculation.
- How are portions calculated? Per recipe and per serving should be clearly distinguished.
- Can the calculation be traced? Can the business see how the result was produced?
- Are assumptions documented? They should be.
- Can the methodology be updated? The system should be capable of handling evolving data.
These questions are often more valuable than simply asking "how accurate is your carbon calculator?"
From Carbon Calculator to Carbon Data Platform
A basic calculator might perform quantity × emissions factor. A carbon data platform can go much further. It can manage:
That is a fundamentally different proposition. The calculator performs the arithmetic. The platform manages the information behind the arithmetic.
The Bigger Picture: One Food Dataset, Multiple Insights
Carbon is also not an isolated dataset. The same ingredient and recipe structure can support:
This creates an opportunity to build a connected food-information architecture. Instead of asking "which tool calculates carbon?" businesses can start asking "how can we turn our recipe data into a reusable source of business intelligence?" That is a much bigger opportunity.
The TRUIX Perspective
At TRUIX, we believe carbon analysis should be treated as a data problem with a calculation layer, not simply as a calculator. The calculation is important. But so are the ingredients behind it — the emissions factors, the sources, the geography, the system boundary, the recipe yield, the portion size, the assumptions, the version of the data, and the ability to trace the final number back to its underlying information.
This is why better carbon intelligence starts with better carbon data. A business doesn't necessarily need a number with six decimal places. It needs a number it can understand, trace, explain and use — the same principle that shapes how we approach technology more broadly, as described in Digital Transformation Isn't About Buying More Software.
Because sustainability decisions become more meaningful when the data behind them is transparent. And when recipe data, ingredient data, nutrition, costing and carbon are connected, sustainability stops being just another report. It becomes part of the business's information system.
Better understanding. Better decisions.
Related Reading
- Why Good Sustainability Reporting Starts With Good Data
- How Technology Can Automate Carbon Accounting
- From Spreadsheets to Carbon Intelligence
- Building More Sustainable Menus With Better Data
- How Hotels Can Use Menu Data to Understand Environmental Impact
- Why Ingredient Data Is a Strategic Business Asset
- Understanding the Carbon Footprint of a Recipe
- Why Food Carbon Accounting Starts With the Recipe
- What Happens When Recipes Become Data?
- The Hidden Nutritional Complexity of a 5-Star Hotel Menu
- Nutrition Analysis Is Only Valuable When It Becomes Actionable Data
- Why Businesses Should Stop Buying Software and Start Building Systems
- Digital Transformation Isn't About Buying More Software
- Carbon Footprint Analysis